East Cape slip map | Brought to you by Dragonfly Data
Science
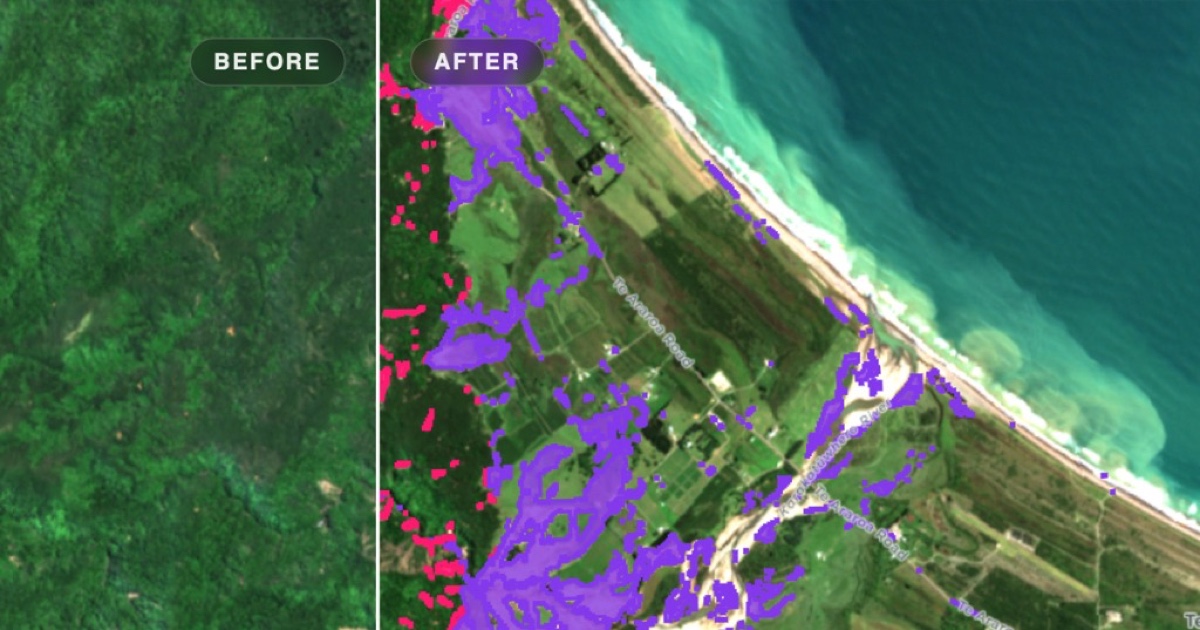
This map visualises the landscape changes in East Cape following the severe weather event in January
2026. Vegetation impacts were assessed by comparing a vegetation index before and after the event,
using
Sentinel‑2 composites from 6 December 2025–12 January 2026 and 24 January–5 February 2026. Only
Changes that significantly exceeded normal annual variability were classified as either slips or
silt.
Areas on slopes steeper than 10 degrees
were classified as slips, and flatter areas as silt deposits
The analysis is preliminary and should be treated as indicative.
Some areas identified as impacted may have been caused by other processes or data uncertainty.
Some slips or areas of silt may not have been identified.
Dragonfly Data Science is a data science agency based in Wellington. We
specialise in machine learning, statistical modelling, and reproducible data workflows to turn
complex data into clear, actionable insights for the environmental and primary sectors.